This section discusses methods for taking measurements visually with the oscilloscope screen. Many digital oscilloscopes have internal software that will take these measurements automatically. Knowing how to take the measurements manually will help you understand and check the automatic measurements of the digital oscilloscopes.
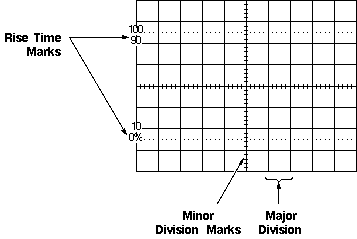
Many oscilloscopes display on the screen how many volts each vertical division represents and how many seconds each horizontal division represents. Many oscilloscopes also have 0%, 10%, 90%, and 100% markings on the graticule (see Figure 1) to help make rise time measurements, described later.

Figure 1: An Oscilloscope Graticule
The oscilloscope is primarily a voltage-measuring device. Once you have measured the voltage, other quantities are just a calculation away. For example, Ohm's law states that voltage between two points in a circuit equals the current times the resistance. From any two of these quantities you can calculate the third. Another handy formula is the power law: the power of a DC signal equals the voltage times the current. Calculations are more complicated for AC signals, but the point here is that measuring the voltage is the first step towards calculating other quantities.

Figure 2 shows the voltage of one peak - V[p] - and the peak-to-peak voltage - V[p-p] -, which is usually twice V[p]. Use the RMS (root-mean-square) voltage - V[RMS] - to calculate the power of an AC signal.

Figure 2: Voltage Peak and Peak-to-peak Voltage
You take voltage measurements by counting the number of divisions a waveform spans on the oscilloscope's vertical scale. Adjusting the signal to cover most of the screen vertically, then taking the measurement along the center vertical graticule line having the smaller divisions, makes for the best voltage measurements. The more screen area you use, the more accurately you can read from the screen.

Figure 3: Measure Voltage on the Center Vertical Graticule Line
Many oscilloscopes have on-screen cursors that let you take waveform measurements automatically on-screen, without having to count graticule marks. Basically, cursors are two horizontal lines for voltage measurements and two vertical lines for time measurements that you can move around the screen. A readout shows the voltage or time at their positions.

Figure 4: Measure Time on the Center Horizontal Graticule Line
Standard pulse measurements are pulse width and pulse rise time. Rise time is the amount of time a pulse takes to go from the low to high voltage. By convention, the rise time is measured from 10% to 90% of the full voltage of the pulse. This eliminates any irregularities at the pulse's transition corners. This also explains why most oscilloscopes have 10% and 90% markings on their screen. Pulse width is the amount of time the pulse takes to go from low to high and back to low again. By convention, the pulse width is measured at 50% of full voltage. See Figure 5 for these measurement points.

Figure 5: Rise Time and Pulse Width Measurement Points
Pulse measurements often require fine-tuning the triggering. To become an expert at capturing pulses, you should learn how to use trigger holdoff and how to set the digital oscilloscope to capture pretrigger data, as described earlier in the Controls section. Horizontal magnification is another useful feature for measuring pulses, since it allows you to see fine details of a fast pulse.
The phase of a wave is the amount of time that passes from the beginning of a cycle to the beginning of the next cycle, measured in degrees. Phase shift describes the difference in timing between two otherwise identical periodic signals.
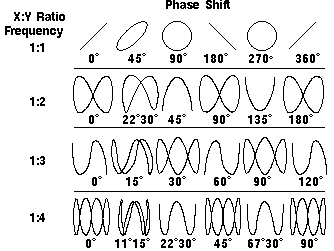
One method for measuring phase shift is to use XY mode. This involves inputting one signal into the vertical system as usual and then another signal into the horizontal system. (This method only works if both signals are sine waves.) This set up is called an XY measurement because both the X and Y axis are tracing voltages. The waveform resulting from this arrangement is called a Lissajous pattern (named for French physicist Jules Antoine Lissajous and pronounced LEE-sa-zhoo). From the shape of the Lissajous pattern, you can tell the phase difference between the two signals. You can also tell their frequency ratio. Figure 6 shows Lissajous patterns for various frequency ratios and phase shifts.

Figure 6: Lissajous Patterns