Learning a new skill often involves learning a new vocabulary.
This idea holds true for learning how to use an oscilloscope. This section
describes some useful measurement and oscilloscope performance terms.
The generic term for a pattern that
repeats over time is a wave - sound waves, brain waves, ocean waves, and
voltage waves are all repeating patterns. An oscilloscope measures voltage
waves. One cycle of a wave is the portion of the wave that repeats. A
waveform is a graphic representation of a wave. A voltage waveform shows
time on the horizontal axis and voltage on the vertical axis.
Waveform shapes tell you a great
deal about a signal. Any time you see a change in the height of the waveform,
you know the voltage has changed. Any time there is a flat horizontal line, you
know that there is no change for that length of time. Straight diagonal lines
mean a linear change - rise or fall of voltage at a steady rate. Sharp angles on
a waveform mean sudden change. Figure 1 shows common waveforms and Figure 2
shows some common sources of waveforms.
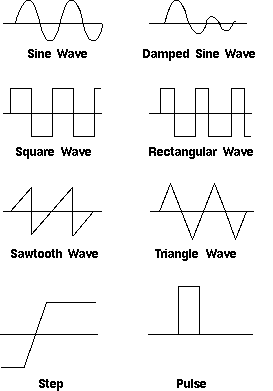
Figure 1: Common Waveforms
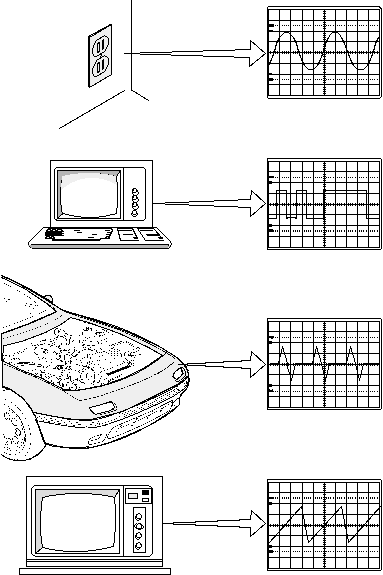
Figure 2: Sources of Common Waveforms
Types of Waves
You can classify most waves into these types:
- Sine waves
- Square and rectangular waves
- Triangle and sawtooth waves
- Step and pulse shapes
The sine wave is the
fundamental wave shape for several reasons. It has harmonious
mathematical properties - it is the same sine shape you may have studied in high
school trigonometry class. The voltage in your wall outlet varies as a sine
wave. Test signals produced by the oscillator circuit of a signal generator are
often sine waves. Most AC power sources produce sine waves. (AC stands
for alternating current, although the voltage alternates too. DC stands
for direct current, which means a steady current and voltage, such as a battery
produces.)
The damped sine wave is a
special case you may see in a circuit that oscillates but winds down over time.
Figure 3 shows examples of sine and damped sine waves.

Figure 3: Sine and Damped Sine Waves
Square and Rectangular Waves
The square wave is another
common wave shape. Basically, a square wave is a voltage that
turns on and off (or goes high and low) at regular intervals. It is a
standard wave for testing amplifiers - good amplifiers increase the amplitude of
a square wave with minimum distortion. Television, radio, and computer circuitry
often use square waves for timing signals.
The rectangular wave is like
the square wave except that the high and low time intervals are not of equal
length. It is particularly important when analyzing digital circuitry.
Figure 4 shows examples of square and rectangular waves.

Figure 4: Square and Rectangular Waves
Sawtooth and Triangle Waves
Sawtooth and Triangle waves result
from circuits designed to control voltages linearly, such as the horizontal
sweep of an analog oscilloscope or the raster scan of a television. The
transitions between voltage levels of these waves change at a constant rate.
These transitions are called ramps.
Figure 5 shows examples of sawtooth and triangle waves.

Figure 5: Sawtooth and Triangle Waves
Step and Pulse Shapes
Signals such as steps and
pulses that only occur once are called single-shot or
transient signals. The step indicates a sudden change in voltage, like
what you would see if you turned on a power switch. The pulse indicates what you
would see if you turned a power switch on and then off again. It might represent
one bit of information traveling through a computer circuit or it might be a
glitch (a defect) in a circuit.
A collection of pulses travelling
together creates a pulse train. Digital components in a computer
communicate with each other using pulses. Pulses are also common in x-ray and
communications equipment.
Figure 6 shows examples of step and pulse shapes and a pulse train.

Figure 6: Step, Pulse, and Pulse Train Shapes
Waveform Measurements
You use many terms to describe the types of
measurements that you take with your oscilloscope. This section describes some
of the most common measurements and terms.
Frequency and Period
If a
signal repeats, it has a frequency. The frequency is measured in Hertz
(Hz) and equals the number of times the signal repeats itself in one second (the
cycles per second). A repeating signal also has a period - this is the
amount of time it takes the signal to complete one cycle. Period and frequency
are reciprocals of each other, so that 1/period equals the frequency and
1/frequency equals the period. So, for example, the sine wave in Figure 7 has a
frequency of 3 Hz and a period of 1/3 second.
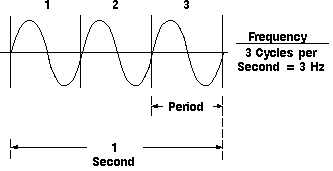
Figure 7: Frequency and Period
Voltage is the amount of electric
potential (a kind of signal strength) between two points in a circuit. Usually
one of these points is ground (zero volts) but not always - you may want to
measure the voltage from the maximum peak to the minimum peak of a waveform,
referred to at the peak-to-peak voltage. The word amplitude commonly refers to
the maximum voltage of a signal measured from ground or zero volts. The waveform
shown in Figure 8 has an amplitude of one volt and a peak-to-peak voltage of two
volts.
Phase
Phase is best explained by looking at a sine wave. Sine
waves are based on circular motion and a circle has 360 degrees. One cycle of a
sine wave has 360 degrees, as shown in Figure 8. Using degrees, you can refer to
the phase angle of a sine wave when you want to describe how much of the period
has elapsed.
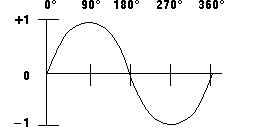
Figure 8: Sine Wave Degrees
Phase shift describes the
difference in timing between two otherwise similar signals. In Figure 9, the
waveform labeled "current" is said to be 905 out of phase with the waveform
labeled "voltage," since the waves reach similar points in their cycles
exactly 1/4 of a cycle apart (360 degrees/4 = 90 degrees). Phase shifts are
common in electronics.
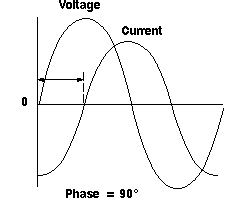
Figure 9: Phase Shift
The terms
described in this section may come up in your discussions about oscilloscope
performance. Understanding these terms will help you evaluate and compare your
oscilloscope with other models.
The bandwidth
specification tells you the frequency range the oscilloscope accurately
measures.
As signal frequency increases, the capability of the oscilloscope to
accurately respond decreases. By convention, the bandwidth tells you the
frequency at which the displayed signal reduces to 70.7% of the applied sine
wave signal. (This 70.7% point is referred to as the "-3 dB point," a term based
on a logarithmic scale.)
Rise Time
Rise time is another
way of describing the useful frequency range of an oscilloscope. Rise time may
be a more appropriate performance consideration when you expect to measure
pulses and steps. An oscilloscope cannot accurately display pulses with rise
times faster than the specified rise time of the oscilloscope.
The
vertical sensitivity indicates how much the vertical amplifier can amplify a
weak signal. Vertical sensitivity is usually given in millivolts (mV) per
division. The smallest voltage a general purpose oscilloscope can detect is
typically about 2 mV per vertical screen division.
For analog
oscilloscopes, this specification indicates how fast the trace can sweep across
the screen, allowing you to see fine details. The fastest sweep speed of an
oscilloscope is usually given in nanoseconds/div.
Gain Accuracy
The gain accuracy
indicates how accurately the vertical system attenuates or amplifies a signal.
This is usually listed as a percentage error.
Time Base or Horizontal
Accuracy
The time base or horizontal accuracy indicates how accurately the
horizontal system displays the timing of a signal. This is usually listed as a
percentage error.
Sample Rate
On digital
oscilloscopes, the sampling rate indicates how many samples per second the ADC
(and therefore the oscilloscope) can acquire. Maximum sample rates are
usually given in megasamples per second (MS/s). The faster the oscilloscope can
sample, the more accurately it can represent fine details in a fast signal. The
minimum sample rate may also be important if you need to look at slowly changing
signals over long periods of time. Typically, the sample rate changes with
changes made to the sec/div control to maintain a constant number of waveform
points in the waveform record.
ADC Resolution (Or Vertical
Resolution)
The resolution, in bits, of the ADC (and therefore the digital
oscilloscope) indicates how precisely it can turn input voltages into
digital values. Calculation techniques can improve the effective resolution.
Record Length
The record length of a digital oscilloscope indicates how
many waveform points the oscilloscope is able to acquire for one waveform
record. Some digital oscilloscopes let you adjust the record length. The maximum
record length depends on the amount of memory in your oscilloscope. Since the
oscilloscope can only store a finite number of waveform points, there is a
trade-off between record detail and record length. You can acquire either a
detailed picture of a signal for a short period of time (the oscilloscope "fills
up" on waveform points quickly) or a less detailed picture for a longer period
of time. Some oscilloscopes let you add more memory to increase the record
length for special applications.
Next Chapter: Setting Up
Previous Chapter: The Oscilloscope


